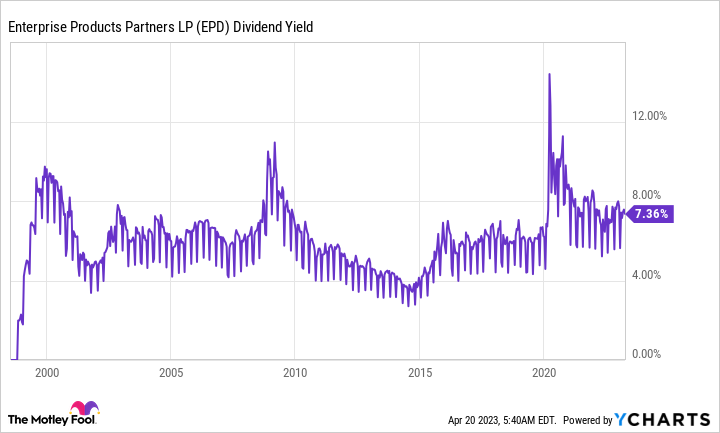
Investors looking to generate a reliable and growing income stream should take a close look at Enterprise Products Partners (EPD 0.45%) and its generous 7.2% distribution yield. While not perfect for everyone, this master limited partnership (MLP) offers an impressive combination of attributes that should please most dividend investors, as shown by the following charts and table.
1. A big yield
If you are a dividend investor, then the first thing you’ll probably be attracted to is Enterprise’s yield. At 7.2% it is large on an absolute basis, but it is also toward the high side of the MLP’s historical yield range. That suggests that this midstream giant is trading at a reasonably attractive price today.
EPD Dividend Yield data by YCharts
But that’s a comparison to itself. Enterprise’s yield is also high relative to both the S&P 500 index and the broader energy sector, using Vanguard Energy ETF as a proxy. You can find midstream companies that have a higher yield, but there are other features unique to Enterprise that make it stand out from the pack.
EPD Dividend Yield data by YCharts
2. A powerful history
The board of directors of an MLP is responsible for deciding the distribution policy. It is important to gauge the commitment to the distribution, but you can only get a handle on that by watching what is done over time. In the case of Enterprise, the history is a solid one, with 24 consecutive years of annual distribution increases.
EPD Dividend Per Share (Quarterly) data by YCharts
What’s really notable about the graph above is that the steadily rising distribution is being compared to the highly volatile price of oil (in this case international benchmark Brent Crude). Despite the massive ups and downs in the energy sector, Enterprise, with a largely fee-based business backed by vital infrastructure assets, has been able to continue rewarding investors with distribution increases.
3. Plenty of coverage
In the midstream space, a key metric is distribution coverage, which compares distributable cash flow to the distribution. Historically, a coverage ratio of 1.2 times was considered strong, and Enterprise was usually at that level or higher. However, more recently, higher coverage ratios have been the norm. In 2022 Enterprise’s distribution coverage sat at 1.9 times.
2018
2019
2020
2021
2022
Distribution coverage
1.5x
1.7x
1.6x
1.7x
1.9x
Data source: Enterprise Products Partners.
Notice the steady increase in the table above. That’s related to management’s goal of funding its capital spending needs with operational cash flow to the greatest extent possible. This is a positive in that Enterprise is less reliant on issuing potentially dilutive units to fund its growth plans. Thus, the higher coverage doesn’t mean the distribution could be increased by 90% overnight. But it does provide a huge amount of leeway for adversity before a distribution cut would be a risk.
4. Solid foundation
The last point that will interest income-focused investors is Enterprise’s investment-grade-rated balance sheet. In the grand scheme of things, a distribution is only as strong as a partnership’s finances, so this is very important. But a comparison using debt-to-EBITDA (earnings before interest, taxes, depreciation, and amortization), the most common industry leverage metric, with similarly sized peers helps to show just how strong Enterprise really is.
EPD Financial Debt to EBITDA (TTM) data by YCharts
Notice that Enterprise is, and has long been, at the low end of the group on this metric. Essentially, being fiscally conservative is the norm for this midstream giant. And that should give unitholders confidence that their quarterly checks will keep arriving uninterrupted.
Time for a deeper dive
Enterprise isn’t perfect. For example, most of the best midstream opportunities have been exploited, so slow growth is likely in the future. But the high current yield makes up for that, assuming you are interested in maximizing your passive income stream today. Also, MLPs come with tax issues, including having to deal with a K-1 form. But MLPs also produce tax-advantaged income, so there’s a reason to take on the extra work come April 15 each year. In other words, there are pros and cons that have to be weighed, but the big yield is pretty clearly a net positive when examining the charts and table above.
